Differential Bacterial Abundance Analysis
Microbiome / 16/18S rRNA-seq / Diffential abundance analysis
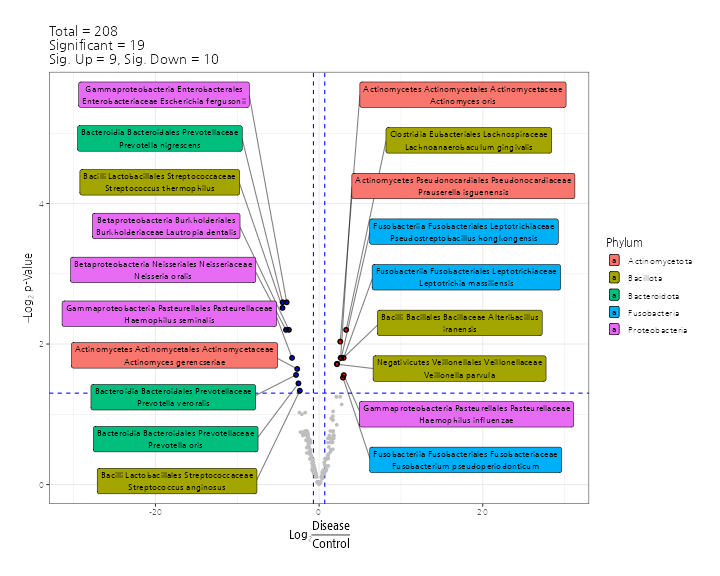
This plot illustrates the significant differences in bacterial abundance between two conditions, represented logarithmically on the x-axis. Each point represents a bacterial taxon, color-coded by phylum. A total of 19 taxa show significant changes, with 9 taxa increasing and 10 decreasing.