Spatial Transcriptomics Analysis of Liver Tissue
Transcriptomics / Spatial Transcriptomics / Feature plot
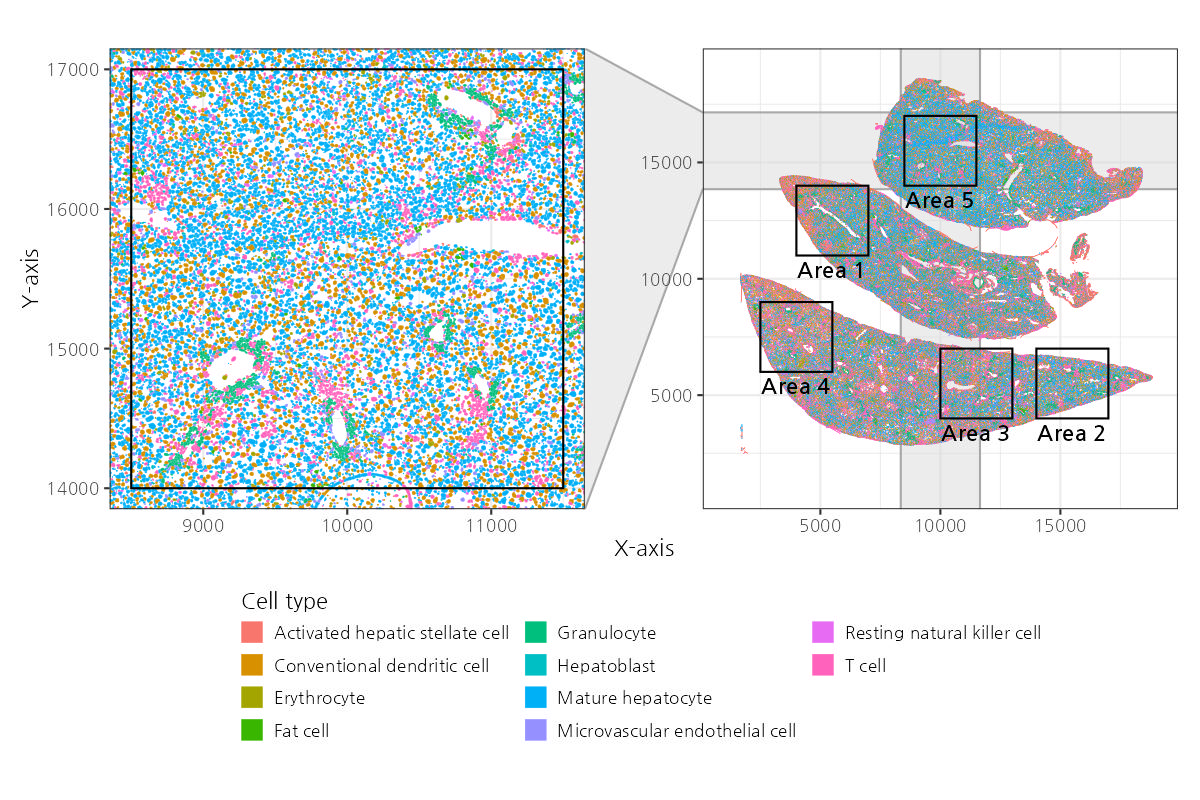
This figure presents a spatial transcriptomics analysis of liver tissue with a focus on various cell types. The left panel shows the high-resolution map with color-coded cell types such as hepatoblasts, mature hepatocytes, and erythrocytes. The right panel highlights specific areas of interest (Area 1 to Area 5) for detailed analysis. Cell types are visually distinguished by different colors, detailed in the legend for reference.