GO-gene network plot
Transcriptomics / Bulk RNA-seq / Gene ontology analysis
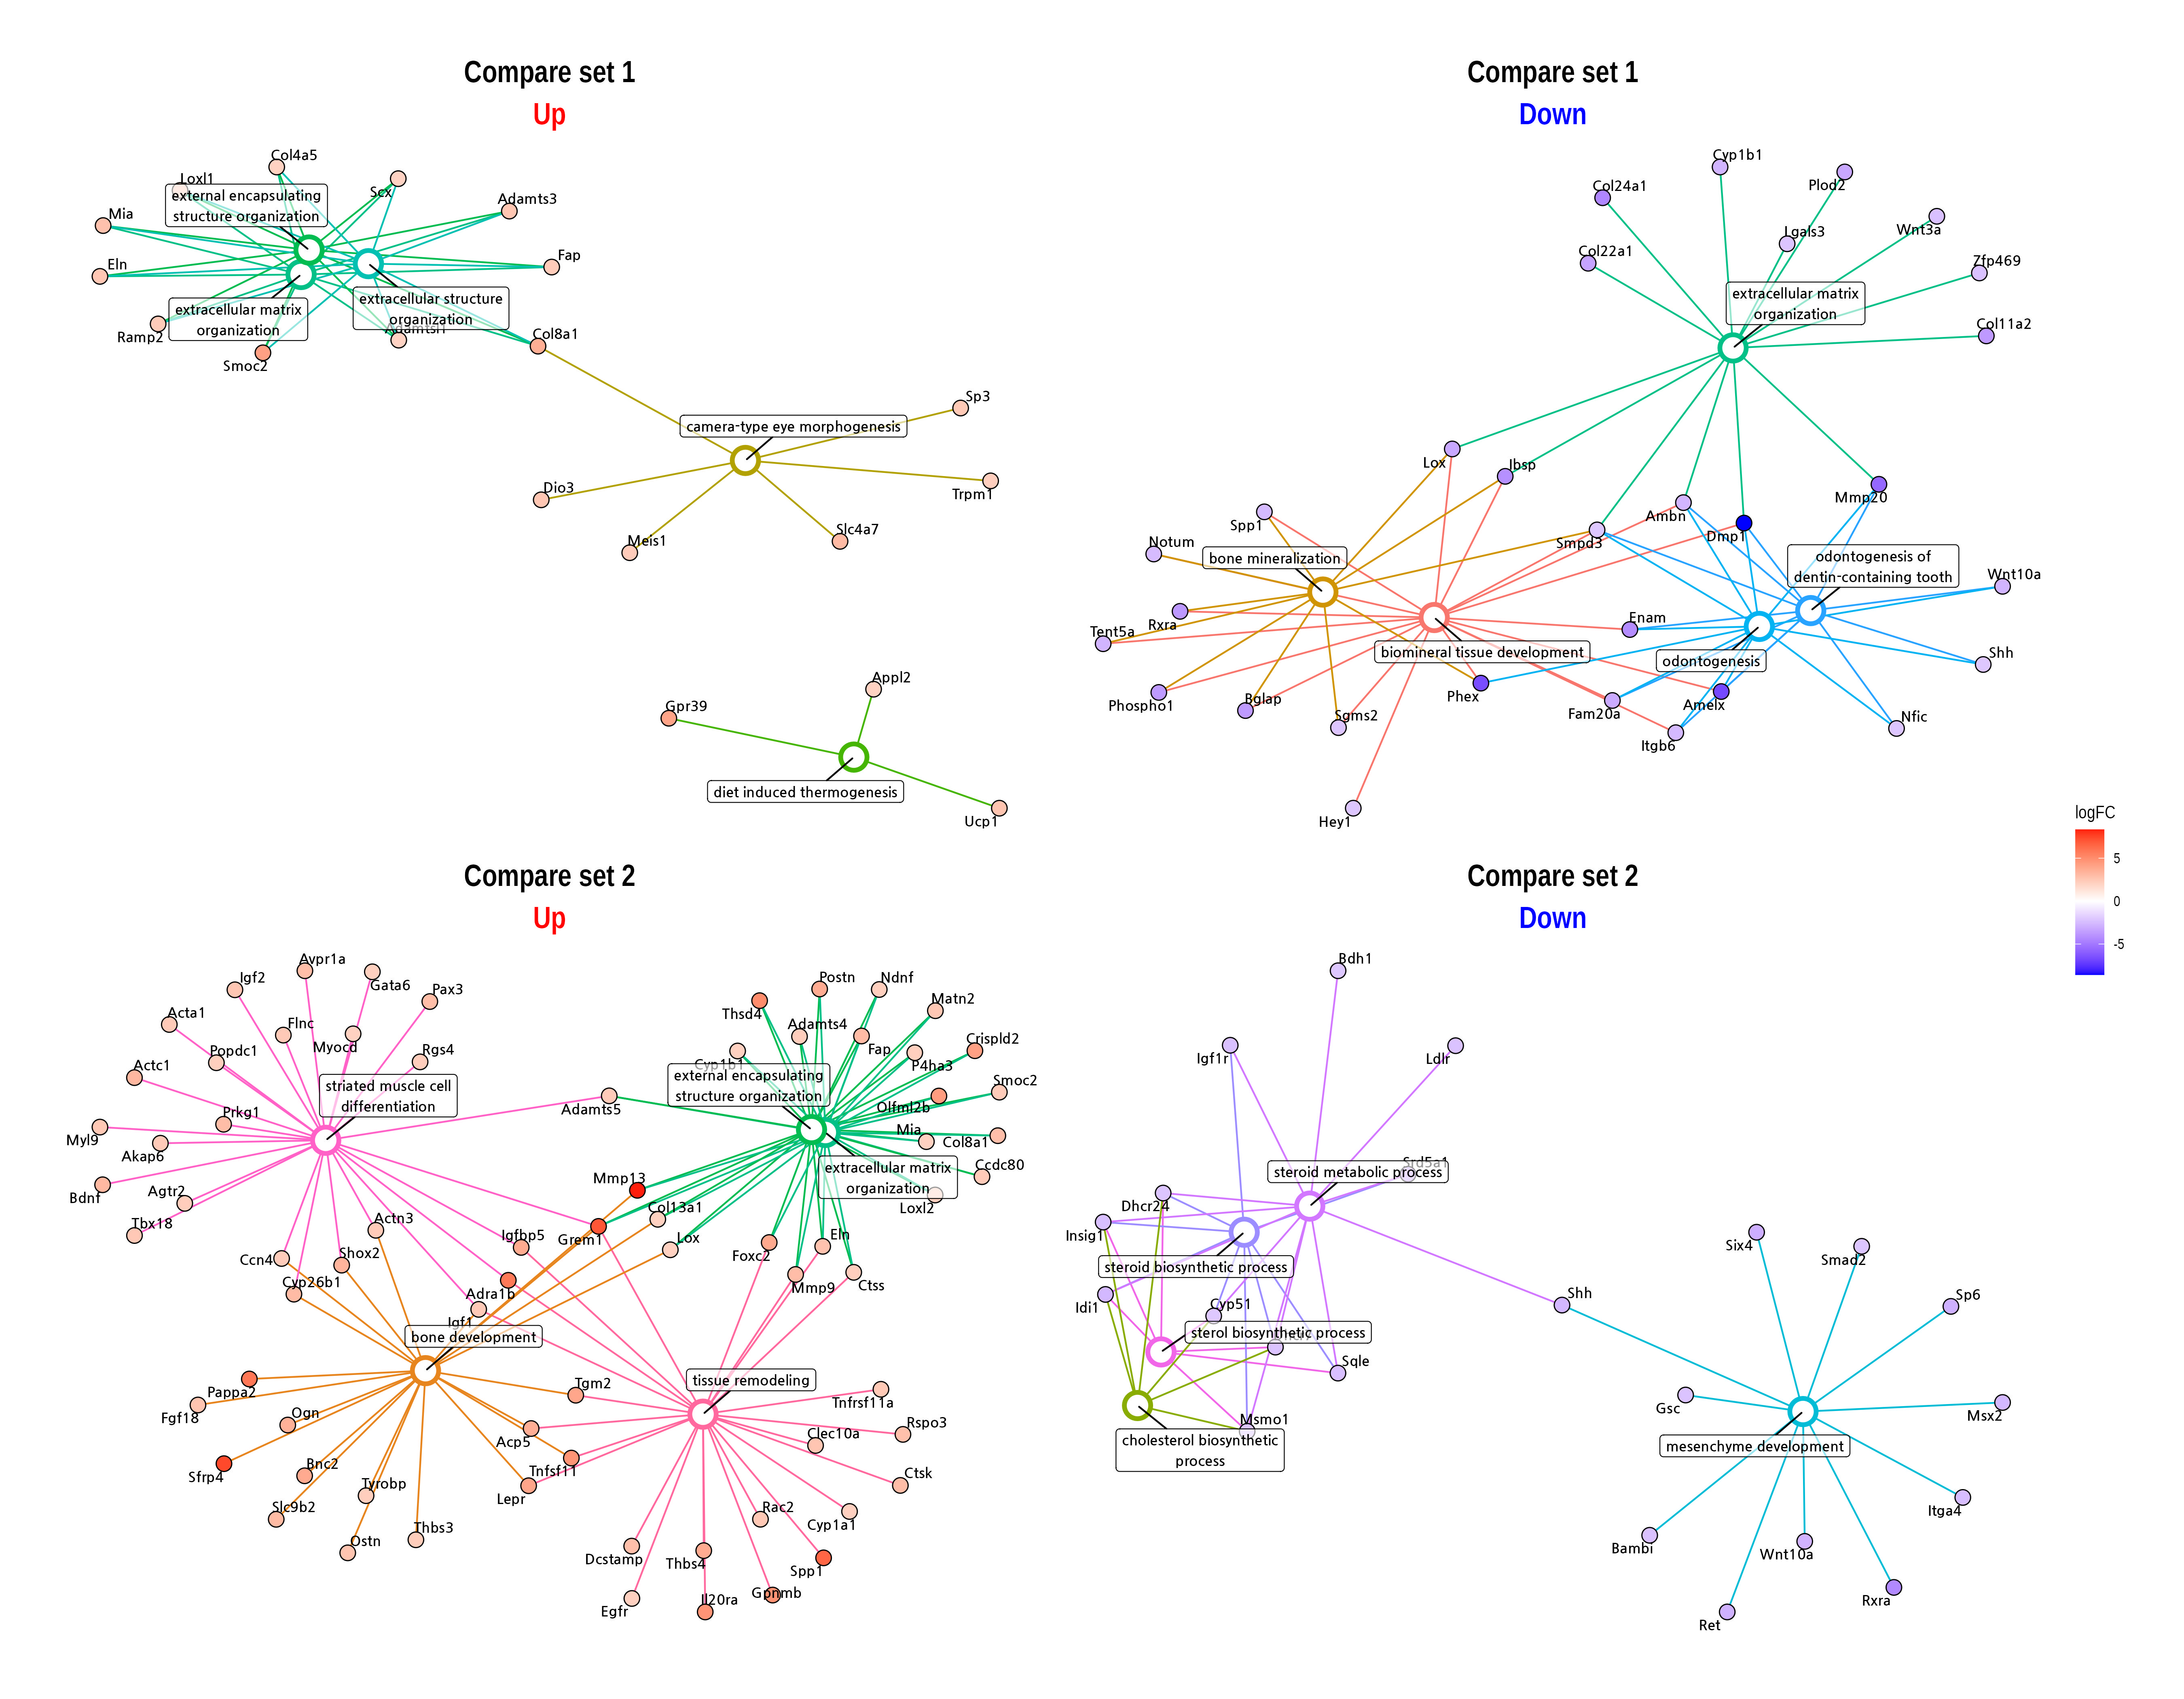
The plot depicts gene expression changes across two comparison sets, highlighting gene ontology (GO) terms enriched on upregulated and downregulated genes. The color of dots indicates the log fold change (logFC) of genes, showing variations in processes like extracellular matrix organization and steroid biosynthesis.