Gene Expression Heatmap and Clusters
Transcriptomics / Bulk RNA-seq / Heatmap with GO analysis
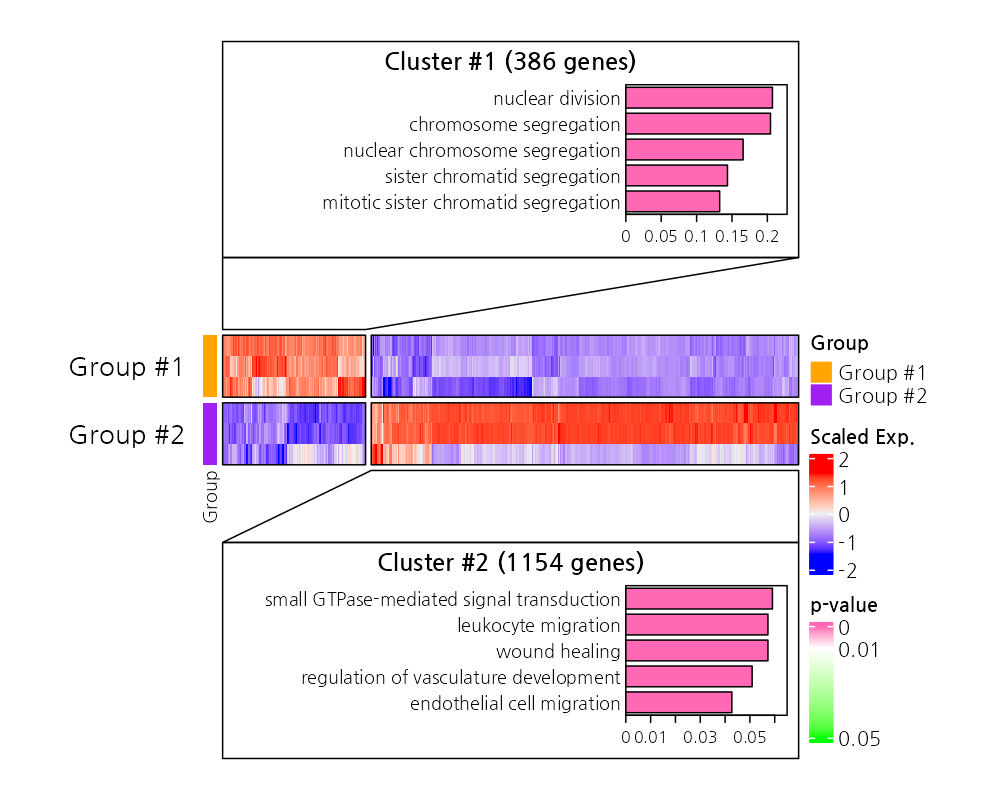
This figure illustrates a heatmap of scaled gene expression levels for two groups, with Group #1 and Group #2 distinguished by color. The heatmap reveals two gene clusters, #1 (386 genes) and #2 (1154 genes), each with associated gene ontology terms and p-values highlighted. The bar charts adjacent to the clusters depict the biological processes enriched in each gene set.