Mutation Distance Across Chromosomes
Genomics / WGS/WES / Rainfall plot
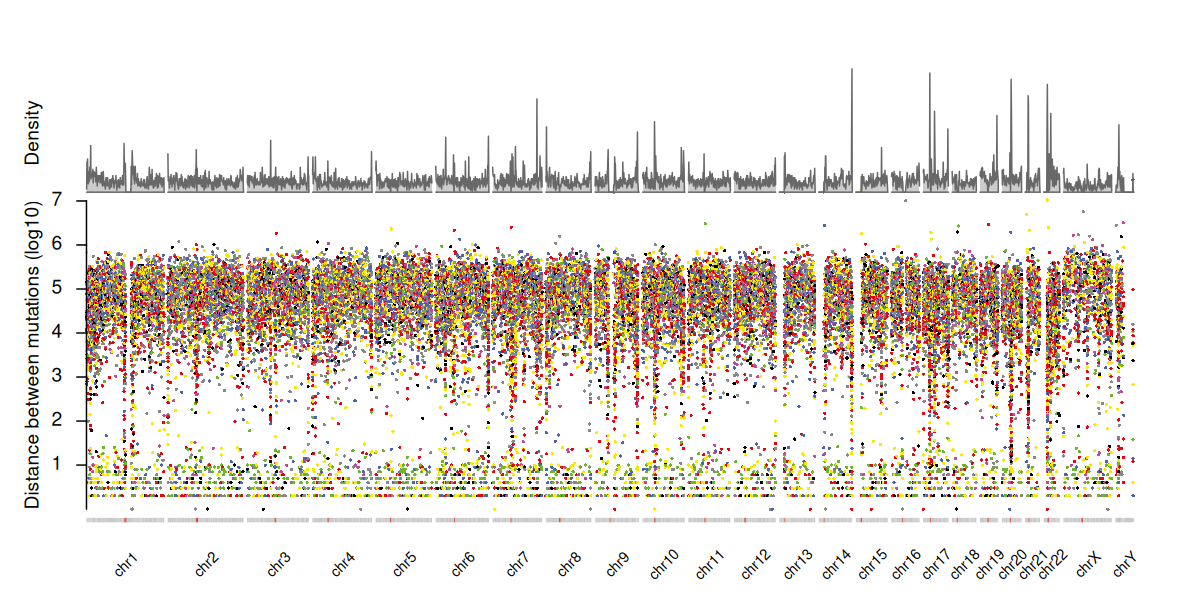
The plot displays the log10 distance between mutations across human chromosomes. Each colored dot represents a mutation’s distance, and chromosomes are labeled from chr1 to chrY. The top bar shows density, indicating the concentration of mutations along the genome.