UMAP Plot of Cell Annotation
Transcriptomics / Single-cell RNA-seq / UMAP and cell annotation
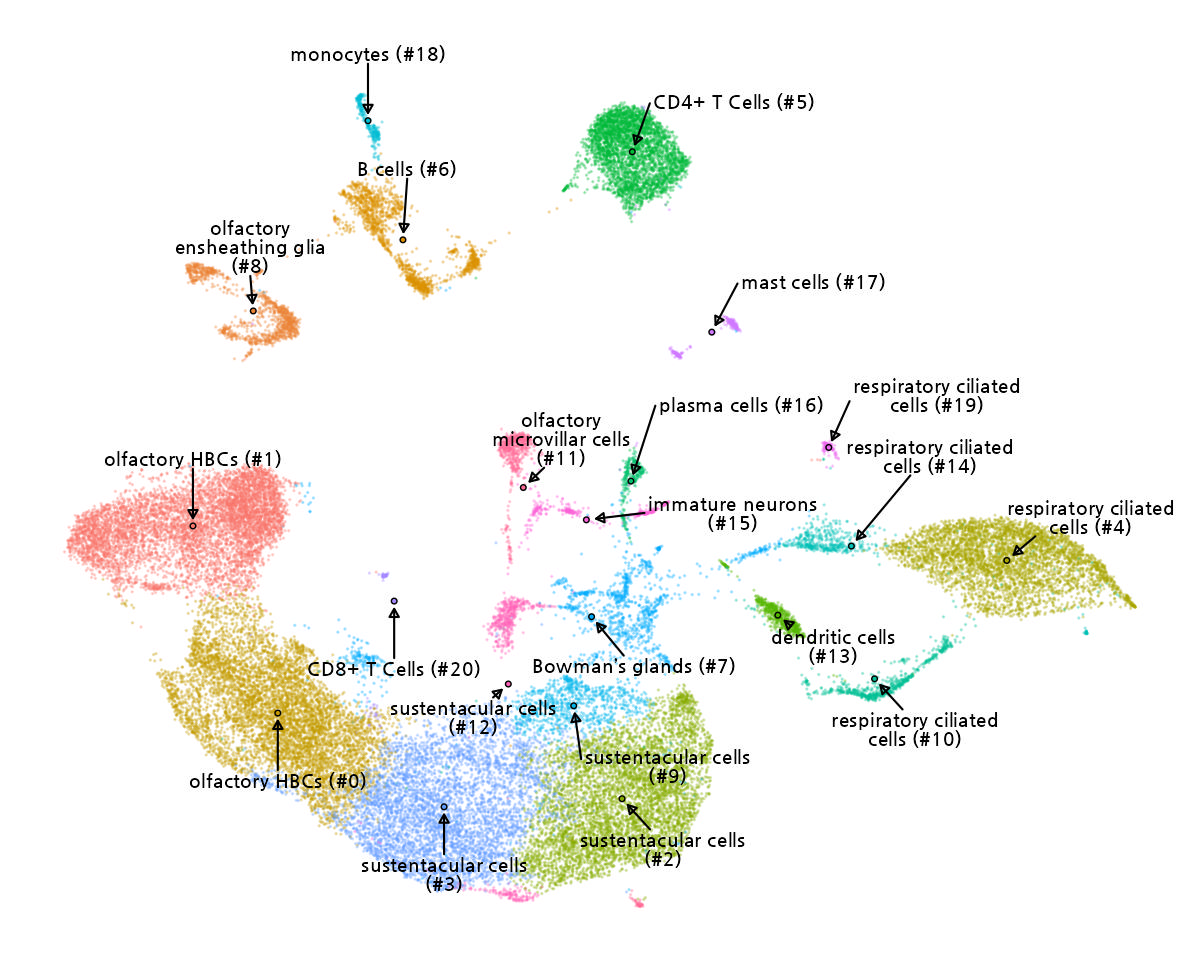
This uniform manifold approximation and projection (UMAP) plot visualizes the distribution of various cell types based on their gene expression profiles. Each color represents a distinct cluster of cells, labeled with specific cell types such as olfactory microvillar cells, B cells, CD4+ T cells, and respiratory ciliated cells. The positioning and clustering of the cells indicate the similarity in their gene expression patterns, allowing for insights into their functional relationships within the tissue.