Volcano Plot - Bulk RNA-seq
Transcriptomics / Bulk RNA-seq / Differential Expression
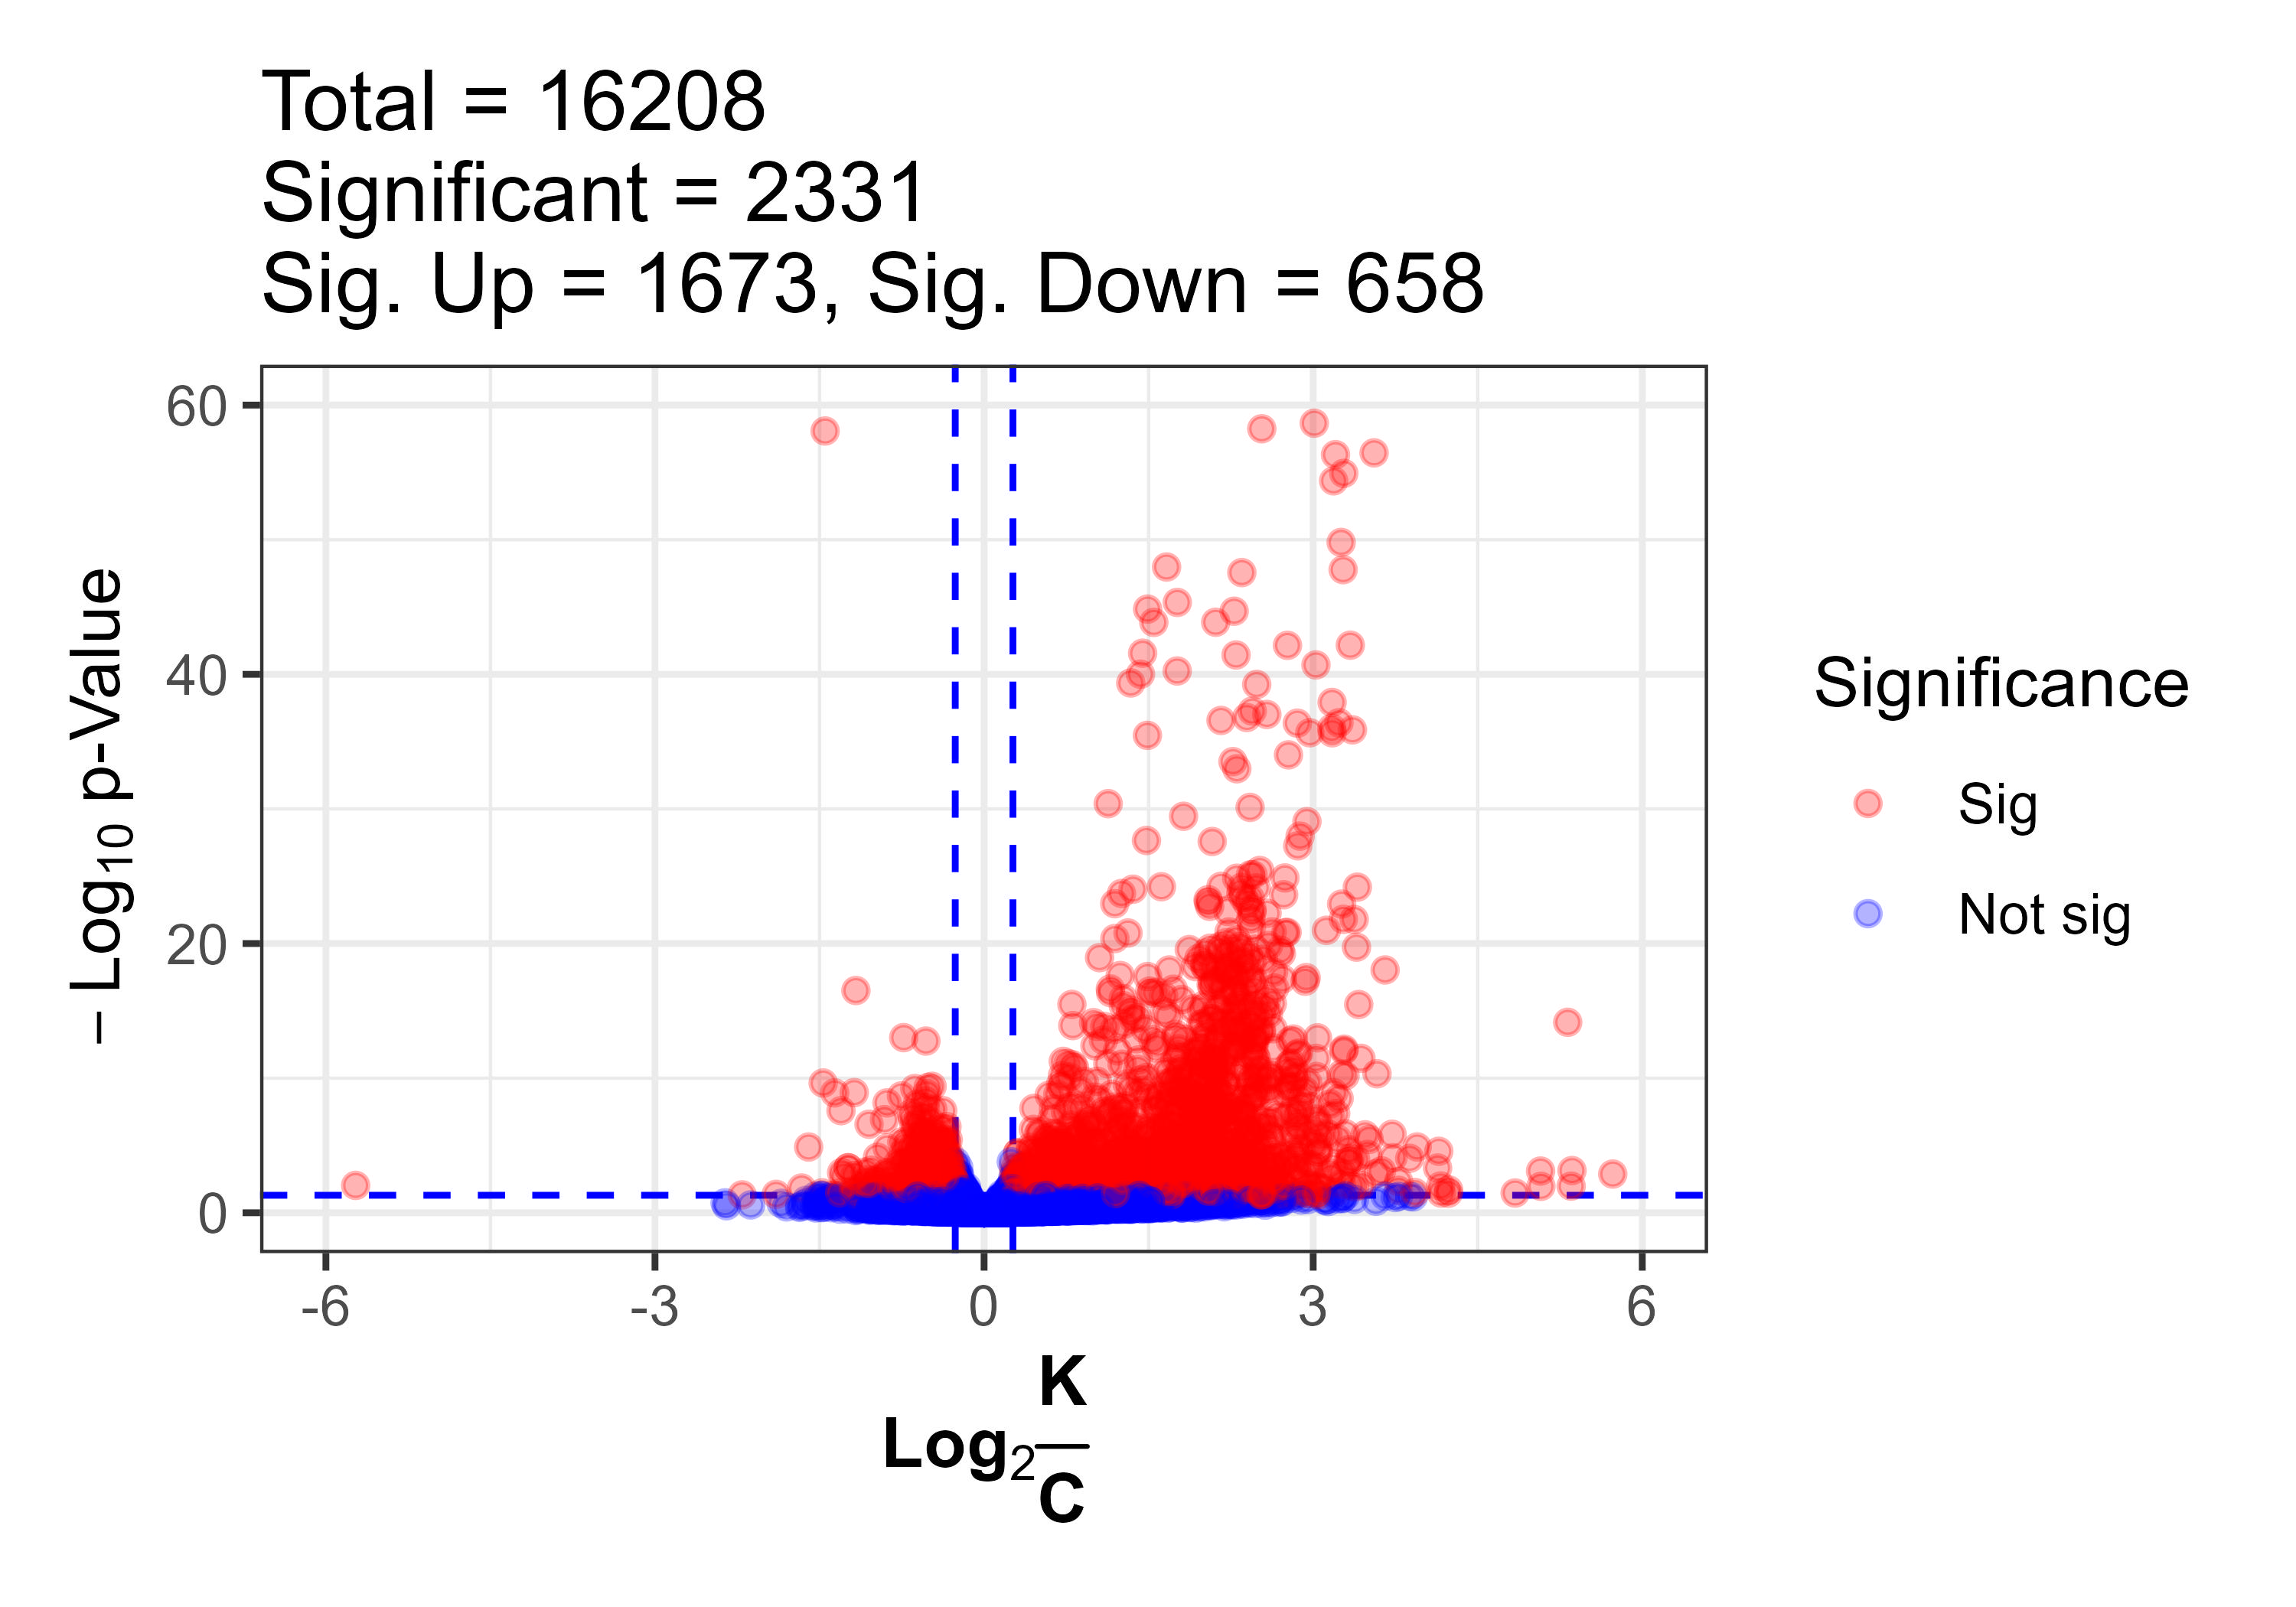
The volcano plot summarizes differential expression results, with each point representing a gene. Genes that are significantly upregulated appear on the right, while downregulated genes appear on the left. Highly significant genes are further from the x-axis.
- Red: Adjusted p-value < 0.05 and log2FC > 1
- Blue: Adjusted p-value < 0.05 and log2FC < -1
- Gray: Not significant